Where Cyber Risk,
Meets Finance
VULC (VUlnerability Loss Calculator) transforms your cybersecurity department from a cost center into an enterprise business enabler. Analyze, Manage, Remediate, and Transfer cyber risks with the help of concrete business metrics.
Simulation Results Dashboard
Monte Carlo trial outputs and calculated risk bounds.
Annual Expected Loss
The total average loss across all simulations.
Cyber Loss Events
Average financial loss and probability of occurrence per loss type.
Maturity baseline achieved: 33% baseline compliance.
Total Likelihood
Probability of at least one cyber incident occurring in a 1-year period.
Refined based on standard threat maps and local infrastructure resilience.
Loss Amount by Impact
Simulated annual losses at low (p50), average, and extreme (p95) scenarios.
Financial Exposure Range
90% confidence interval of simulated annual losses.
Tail outcomes based on standard statistical spread models.
Loss Exceedance Curve (LEC)
Probability of annual losses exceeding any specific financial threshold.
Industry standards recommend configuring cyber insurance policy limits targeting the 95th Percentile Value at Risk (p95 VaR), with a retention (deductible) threshold set around the Median Loss (p50).

Cyber Risk Assessment Report
Risk Profile: FINANCE VERTICAL • DEU JURISDICTION • 123 EMPLOYEES
1. Risk Profile Used for This Assessment
2. Expected Annual Loss & Segment Breakdown
3. Cyber Loss Events Likelihood
4. Threat Likelihood Summary
Rerun this exact model with your own numbers, free, no signup required, in seconds.
Cyber Risk Assessment Report
Risk Profile: FINANCE VERTICAL • DEU JURISDICTION • 123 EMPLOYEES
5. Cyber Loss Severity by Impact Level
Loss severity bounds across Extreme (95th percentile), Average, and Low simulation trials.
6. Actuarial Exceedance Probabilities (LEC)
Probability that total annual losses exceed a given threshold, used to size insurance retention and limits.
Rerun this exact model with your own numbers, free, no signup required, in seconds.
The Science of Cyber Risk Propagation & Financial Impact
Understand how our algorithm works to move beyond static scoring. Vulc uses stochastic modeling and advanced attack-path simulations to map how cyber risk cascades through your infrastructure, quantifying your exposure with actuarial precision.
Learn More
Discover More of Vulc
Learn what else the platform can do.
Solutions for every stage of cyber risk
Centralize cyber risk in a single platform, to transform the cyber department from a defensive necessity to a proactive business driver.
Centralized Multi-Client Command Center
Transform your security advisory into a data-driven revenue engine. Manage all your clients from one central dashboard, identify upsell opportunities, and deliver boardroom-ready reporting that justifies your retainer.

Make Smarter Security Investment Decisions
Prioritize cybersecurity investments based on financially quantified risk scenarios and align your security strategy with real business value.

Translate Cybersecurity Into Business Language
Communicate cyber risk with confidence and simplify regulatory compliance by financially explaining cyber risk exposure and relative business impact.

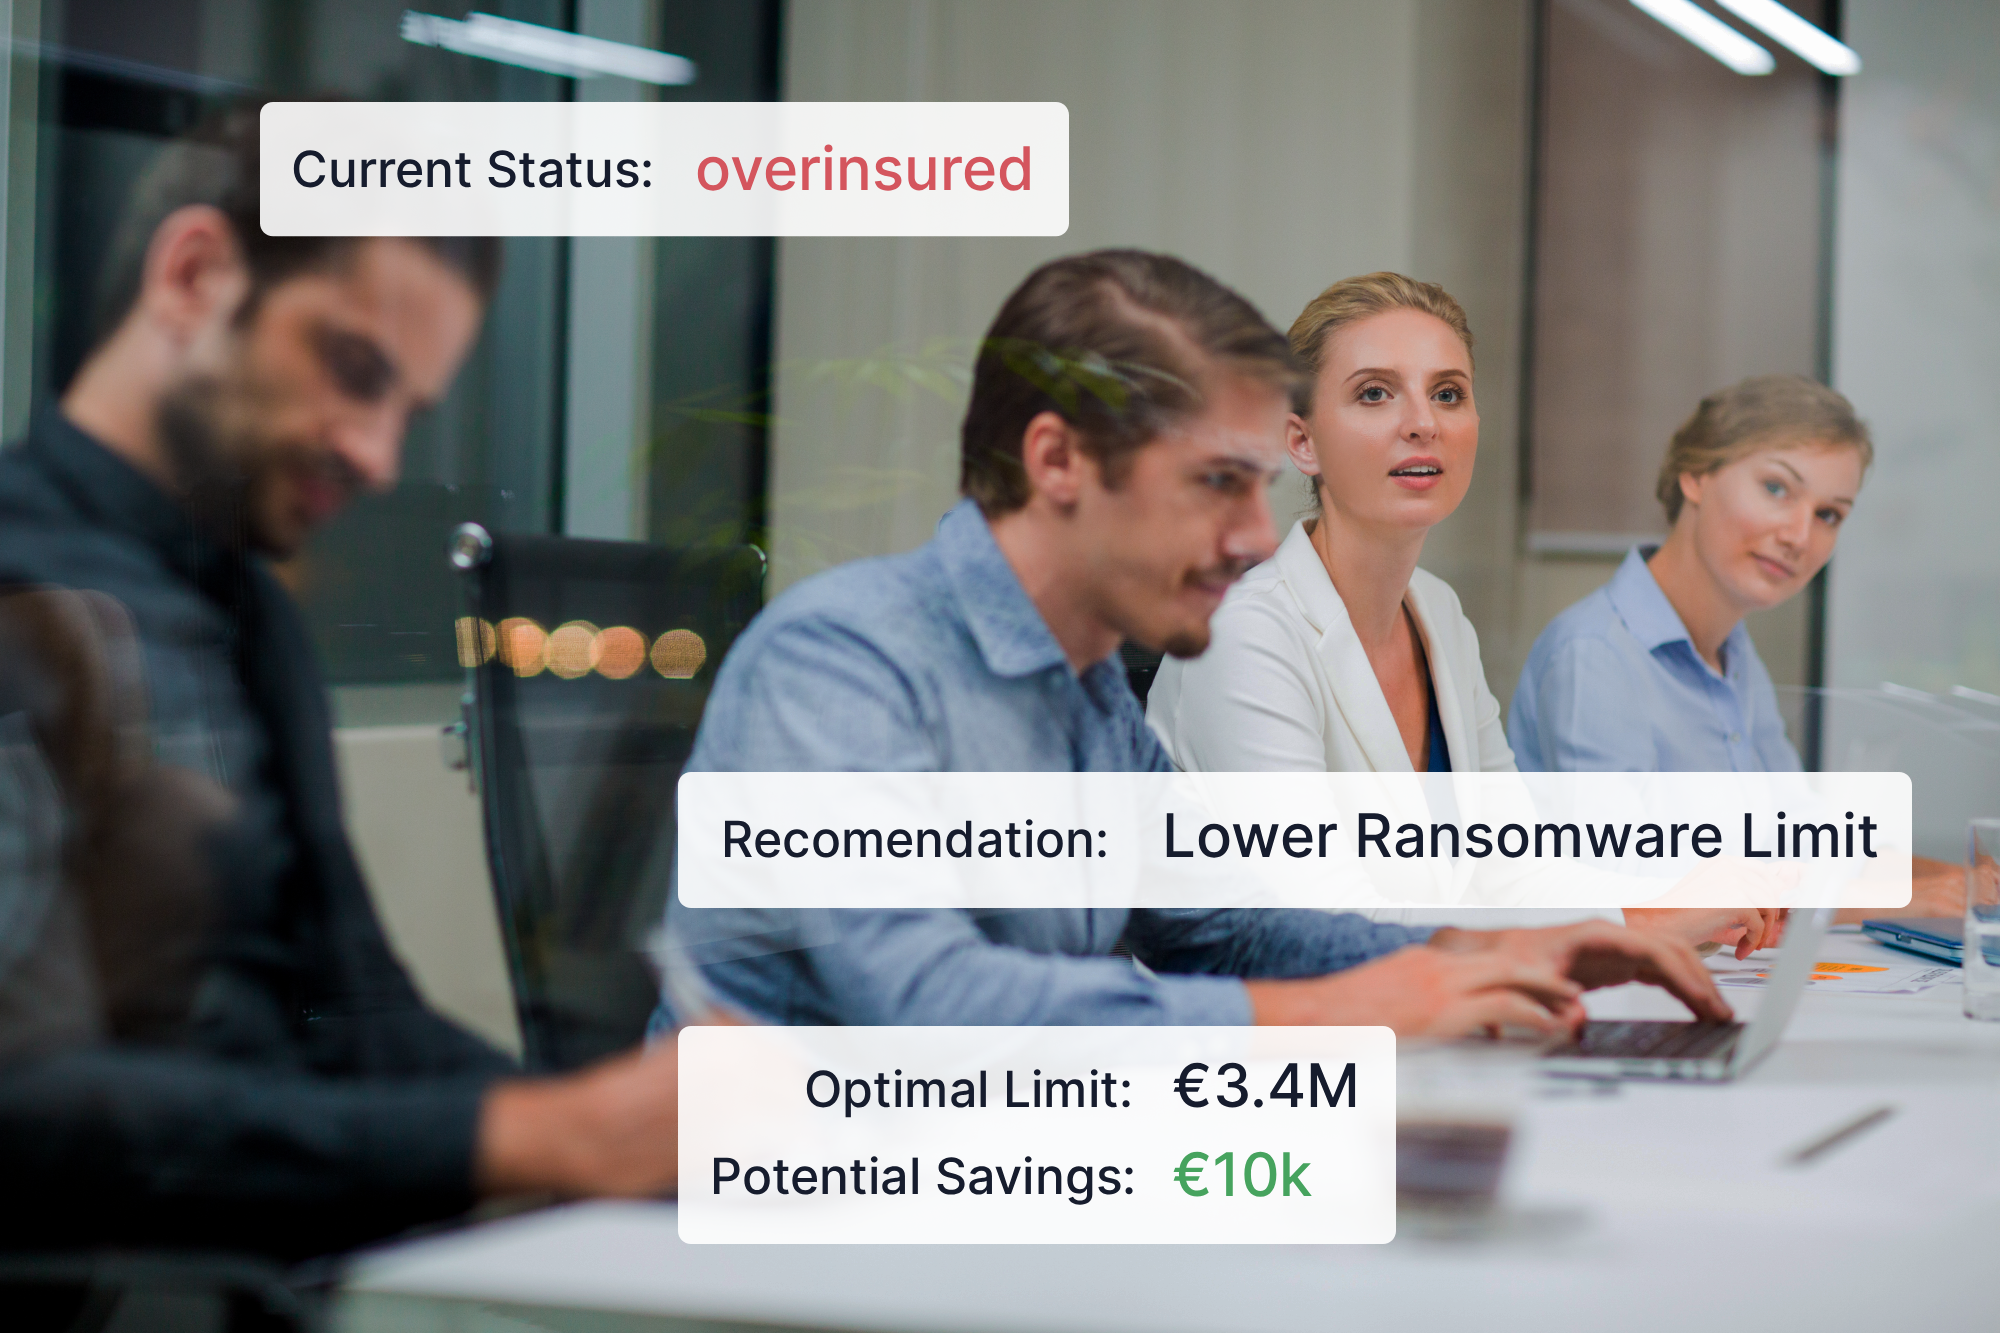
Approach Your Cyber Insurer With Knowledge in Hand
Gain insights to decide on the optimal cyber insurance and drive more cost-effective terms and conditions that keep your organization resilient.
Relevant Resources
Take a look at the following knowledge hub resources for an even better understanding of each topic.


Send the Cyber Risk Department into the Future!
Start today and transform the way your company views cyber risk!